Article by Alex Fotopoulos
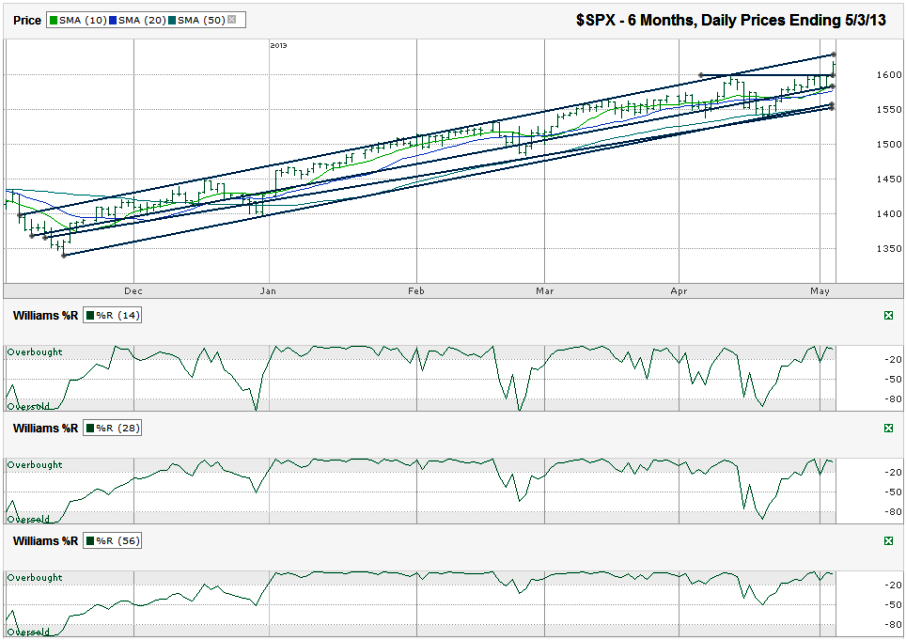
I charted the daily prices for the past six months on the S&P 500 index ($SPX) after the index closed at 1,614.42 on Friday, May 3, 2013.
The SPX has been on the tipping point recently, but didn’t go off the edge. The large cap index rode along its 50-day moving average (dma) for a few days in April and then moved back above its 10 and 20 dma to close out the last few days of the month. 1,600 looked like it would continue as resistance when May rolled around, but after a few days of butting against the ceiling, the SPX gapped higher on Friday to reach new highs.
The SPX has been in its current ascending trading channel for nearly six months and is still showing strength. The 10 dma moved above the 20 dma again and the Williams %R indicator has returned to overbought to show sentiment is clearly favoring the bulls again.
The best the bears can hope for in the near-term is a retest of the round 1,600 line as the index fills in the gap from Friday. Such a move will give the trend lines more time to open up space to move even further higher. Resistance is likely at the trend line of higher highs, but that doesn’t mean a sell-off is going to be triggered there. If the index acts like it has since November, it will ride along this line, torturing the bears every day. The downside can be as deep as 1,550 without breaking support. That’s only 4% below Friday’s close. A break below 1,550 could turn into something worth selling, but until then, it’s hard to fight the chart.
_______________________
Alex Fotopoulos is the President and Chief Investment Officer of an Atlanta based Registered Investment Advisor firm where he personally manages his clients’ accounts along with his own. He is the author of the book My Trader’s Journal 2012 and the popular options blog, www.mytradersjournal.com.
Alex specializes in trading options as a method for reducing risks while seeking alpha. He combines both technical and fundamental analysis in choosing his entry and exit points as a swing trader of index ETFs and a variety of individual stocks.


